Overview
We want to measure the existence of possible anisotropies in the SPT maps in the directions defined by the major and minor axis of the BCG for the SPT clusters.
We selected all the BCGs from R12 sample (134 used here) and in particular the angle theta which defines the major axis of the BCG.
Then we stacked the spt maps by rotating each map according to the above defined angle.
In order to measure the signal we first fold each map (centred at the cluster position) into one quadrant.
In other words we first build maps whose axis are abs(X - Xclus), abs(Y - Yclus).
Then we tried three methods.
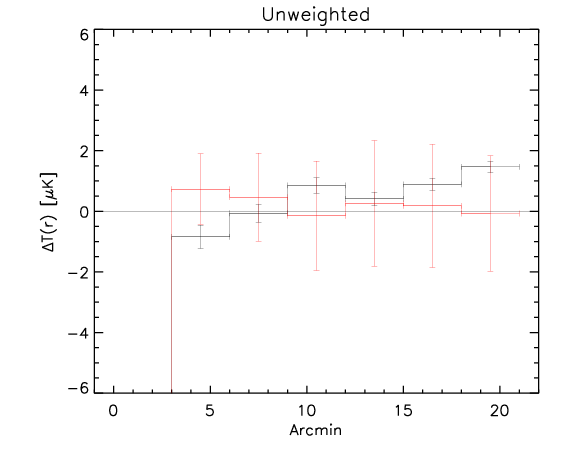
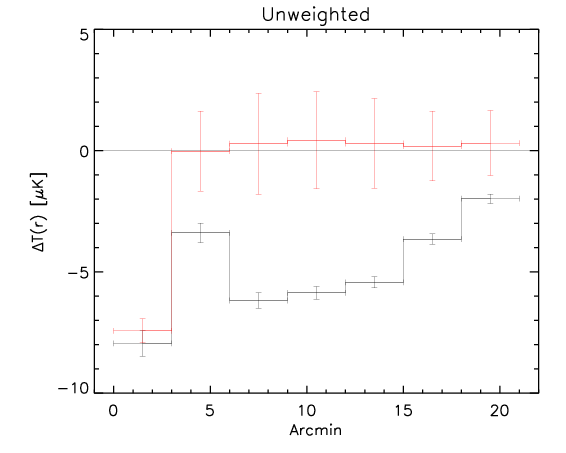
1) We compute the radial profile in the part above and below the bisector and measure the difference of the two.
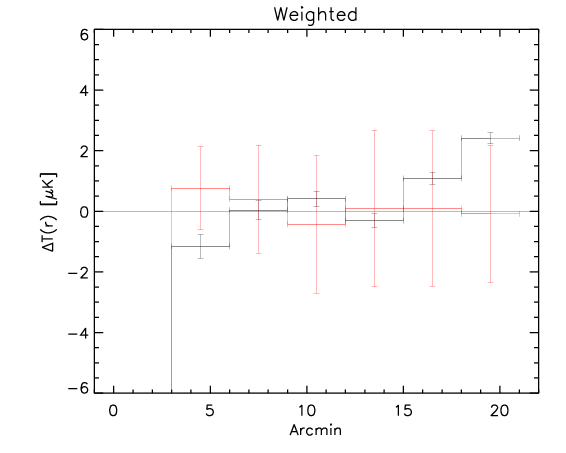
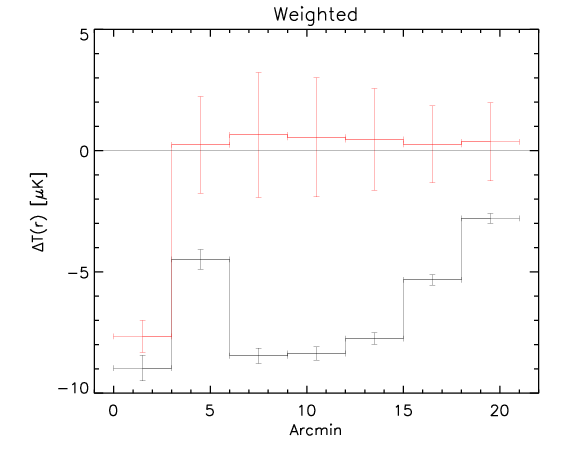
2) Same as above, but in each radial bin we compute the weighed mean temperature, where the weighting is given by cos(2*alpha)^2 and alpha is the angle of the pixel. This is to give weight one for the pixels in the vertical and horizontal axis and weight zero for the pixels on the bisector.
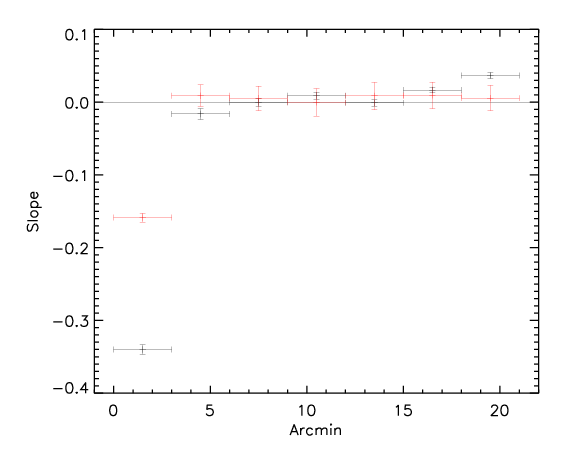
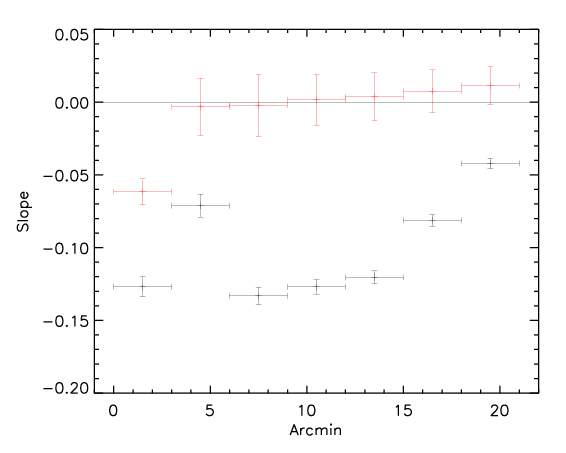
3) For each pixel we define the polar coordinates and plot the temperature in a given radial bin as a function of the angle alpha of the pixel. We then linearly fit this distribution and measure the slope of the fit.
This three methods give comparable answers. However the significance is larger for the method 3 (presumably because it uses the whole dataset and not split into two), intermediate for method 2 and slightly smaller for method 1.
ControlIn order to have an idea about the intrinsic fluctuations, we also realize a number (for example here we used 30) of realizations for which the rotation is made upon a random angle.
Then we apply the same three methods described above and measure the mean and standard deviation of the distributions.
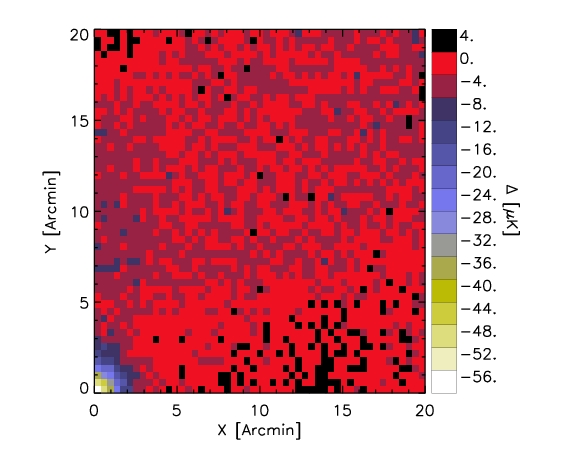
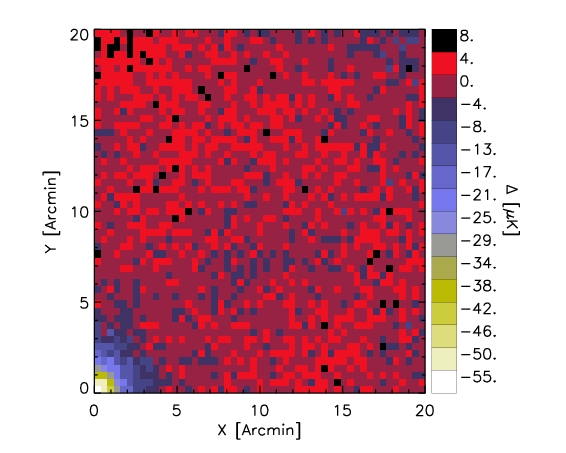
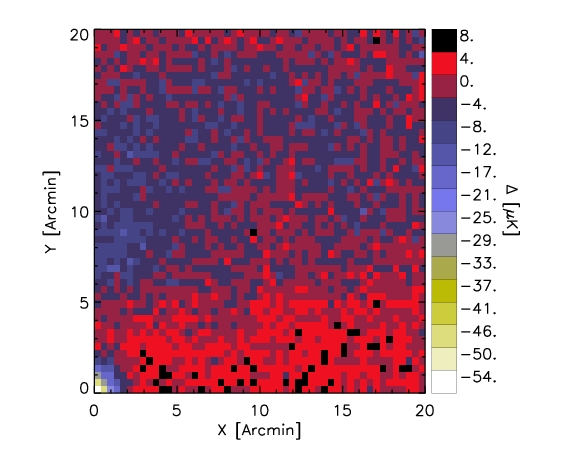
Here we show a map representing the whole stacked sample
Here we show the result for the the three methods (black is the rotated data and red is the control):
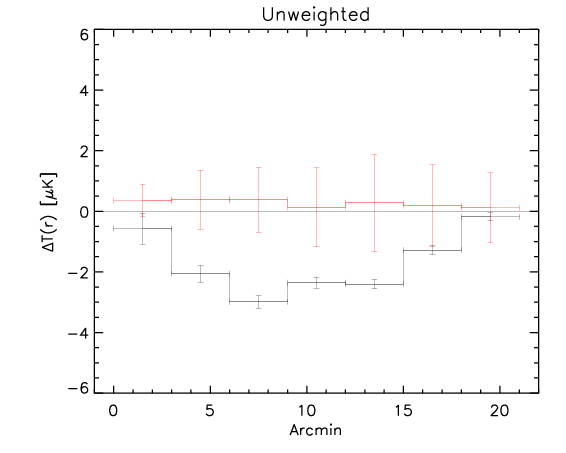
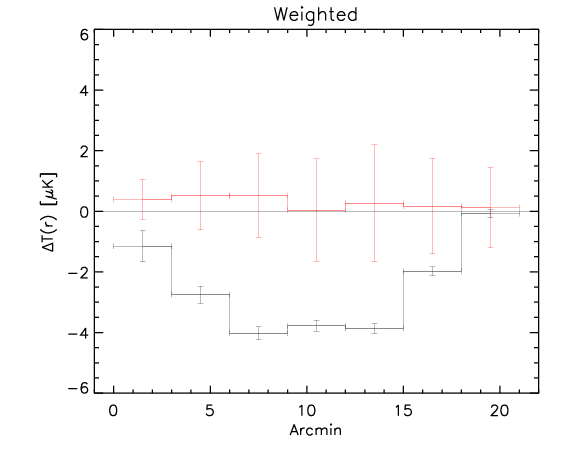
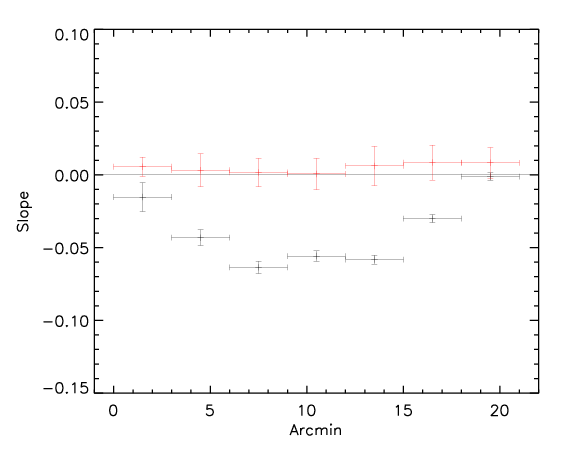
Apparently the signal is quite evident even at large radii.
We then split the sample into two redshift bins at z = 0.55 (more or less the median redshift)
The low redshift subsample apparently doesn't show a strong correlation:
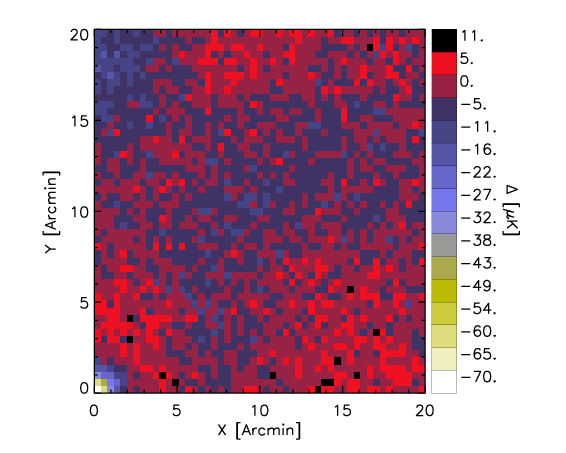
whereas most of the signal is coming from the high redshift subsample:
In the first bin perhaps there is a binning problem.
Here I show a realization for the random control map for the whole sample and high-z subsample.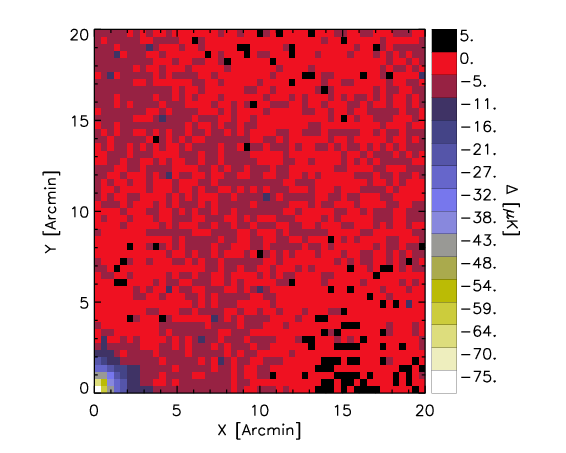
As Jiayi pointed out, any signal could be related to one of this three sources (i don't see any further explanation):
1) Telescope features
2) CMB anisotropies
3) Correlation on large scale
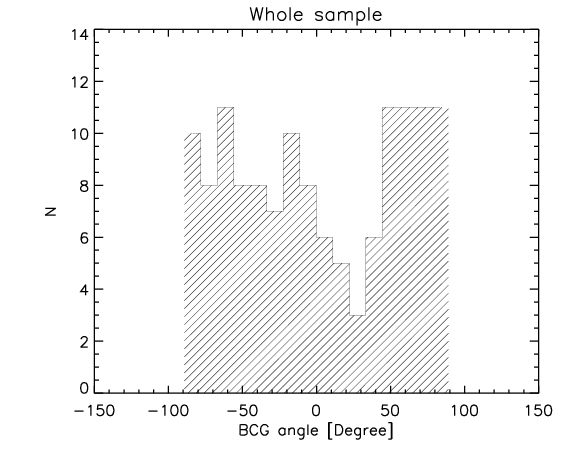
I think it is fair to assume that we can neglect 1) if the distribution of the BCG angles is random.
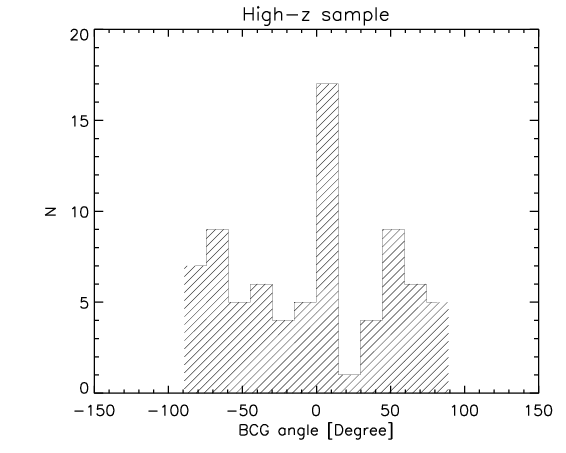
Here I show the distribution of the orientation of the BCGs for the whole sample and the high-z subsample.
They look random and they pass KS test for random distribution:
To test the effect of 2) I made a further test where the number of realization is 1000.
What I show below is how the measured parameters in the aligned case (red continuous lines and associated measured uncertainty) compare with the random control sample estimated from 1000 realizations for the whole sample and the high-z subsample (black histograms).
Whole sample:
High z subsample:
We can see that the aligned signal is quite inconsistent with the random realizations (which should be dominated by CMB fluctuations and nicely follows gaussian distributions consistent with zero,besides first bin where I think I have a binning issue).
Question is: is it a prove enough?
If so, what is the origin?
As discussed, we should check on the distribution of temperatures and would be nice to look at the galaxy distribution as well and cross check with other bands as well.
Members
Manager: Alex Saro